 senn-tech
Monitoring without the baggage: Uptime Kuma in-house
For monitoring internal services, we use Graylog and Zabbix. But for that one question, "Is the service reachable from outside?", there's something leaner: Uptime Kuma.
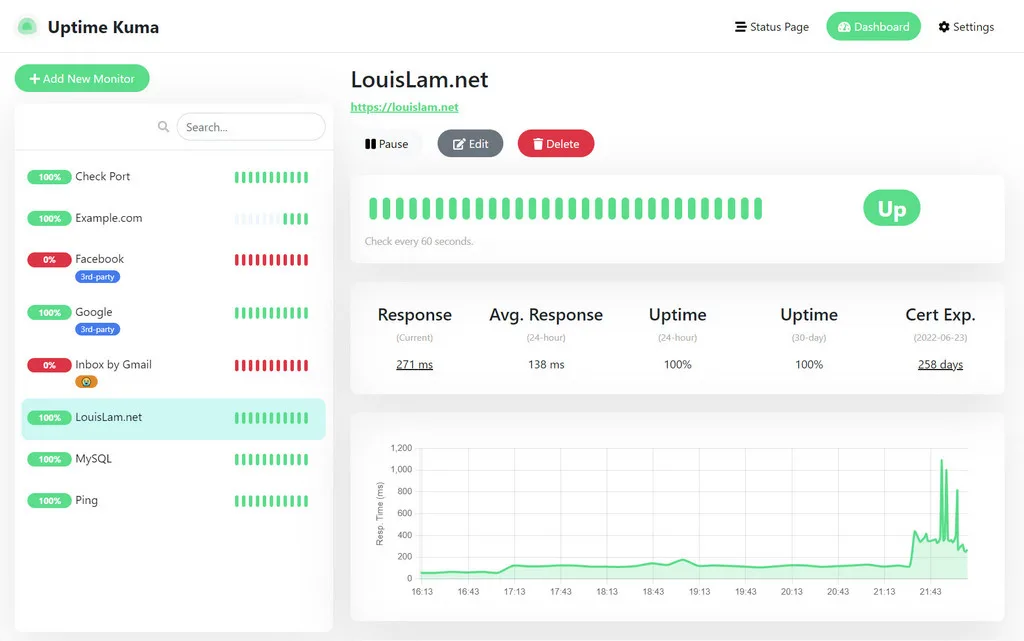
What it does
A Docker container that periodically probes services: HTTP(S), TCP, Ping, DNS, Docker health checks, even REST APIs and MQTT. If one doesn't respond, one of many notifications triggers: email, Telegram, Discord, Signal, webhook.
docker run -d --name uptime-kuma -p 3001:3001 louislam/uptime-kuma:1
The web interface is pleasant and straightforward. One monitor per service, intervals from 20 seconds, heartbeat intervals for cron jobs, certificate expiry warnings included.
What convinced us
Status page out of the box. A public or internal status dashboard, configurable, multilingual, with scheduled maintenance windows so planned work doesn't show as an outage in the history. This is an underestimated feature for customers with their own infrastructure.
No external dependency. If the monitoring itself needs to be monitored, a standalone container in your own network is still the cleanest solution. No SaaS, no API limits.
Lightweight. 100 MB RAM idle, barely any CPU load. The container runs on the same Docker-Linux-VM as other small services, without you having to think about it.
The blind spot: Who watches the watchman?
If Uptime Kuma runs in the same data center as the monitored services, it won't see a site-wide outage, it's then gone itself. We therefore deliberately place the status monitoring on a second, separate location (or a cheap external VPS) so the failure alert still arrives even if the main site goes completely dark.
Where it reaches its limits
Uptime Kuma doesn't replace system monitoring. No metrics on CPU, memory, latency percentiles, for that you still need Prometheus/Grafana or Zabbix. Uptime Kuma checks reachability, not health.
Also, the history is functional, not analytical: you see when a service failed and for how long. Trend analysis over months isn't the goal.
Conclusion
Uptime Kuma is the tool you set up alongside and then forget, until it notifies. Exactly how monitoring should be. We install it by default on every customer VM host.
Further Reading
Does Uptime Kuma replace our system monitoring with Zabbix or Grafana?+
No. Uptime Kuma checks reachability, not health. It provides no metrics on CPU, memory, or latency percentiles, for that you still need Prometheus/Grafana or Zabbix. The history is functional, not analytical: you see when and for how long a service failed, but no trend analysis over months.
How do we learn about a full site outage if the monitor goes down too?+
If Uptime Kuma runs in the same data center as the monitored services, it won't see a site-wide outage, it's gone itself. That's why we deliberately place the status monitoring on a second, separate location or a cheap external VPS, so the alert still arrives even when the main site goes completely dark.
How resource-hungry is it, and does it depend on a cloud service?+
Uptime Kuma is lightweight, around 100 MB RAM idle, barely any CPU load, and runs as a single Docker container in your own network. No SaaS, no API limits, no external dependency. Notifications go via email, Telegram, Discord, Signal, or webhook; a configurable status page with maintenance windows is already built in.