 senn-tech
SIEM & security monitoring with real-time correlation
Reference client: Logistics and trading group in Tyrol, Austria · ~100 employees · 4 sites
Customer data in copy and images has been neutralised.
Starting point
Firewall, email gateway, Microsoft 365, endpoint protection, phone system, cameras, servers, switches: every system diligently generates logs. But no one ever read them: scattered across a dozen consoles, each with its own login, its own interface, and its own alert behavior.
Anomalies were noticed when something was broken. Not when it was starting to break. And a group of around 100 employees is simply too small for a dedicated security team.
The hard part
Collecting logs is the easy part. The hard part is deciding what may interrupt a human being, because a system that reports too much gets dismissed within two weeks and is then worse than none at all: it simulates security where none is happening any more.
An anomaly is not yet a finding. An example from our own operations: for several nights the DNS server reported “disk full”. The measurement was correct, because maintenance of the query database briefly needs twice the space and releases it afterwards. As an alert it was worthless. Three of those a night would have been enough to leave the fourth unread as well.
The second kind points at something that no longer exists in that form. A 98 percent collapse in mail volume looks like an outage; in fact it was a decommissioned mailbox whose journal nobody had switched off.
The most uncomfortable class, though, is the third: a monitor can be green because it sees nothing. And that is not the same as there being nothing to see. The whole difference sits between “no alert” and “no detection”, and from the outside the two are indistinguishable. That is exactly why the pipeline monitors itself.
Solution
A central SIEM was set up on the company's own infrastructure: a lean log pipeline accepts syslog, GELF and API data from around 30 systems: from Microsoft 365 and endpoint security through Proxmox clusters, switches and UPS units to the phone system.
On top of it sits a custom-built monitoring layer: around 60 monitors and real-time correlation rules check every 30 seconds for patterns such as brute-force attempts, impossible sign-in locations or expiring certificates. Scoring, deduplication and prioritization are rule-based. Only what requires action gets delivered; a local language model is on call for deep analysis of individual incidents.
Relevant alerts go out immediately as push and email to the people responsible; everything lower-priority is collected into a digest twice a day.
How it is built
The design is a funnel with four cleanly separated stages: collect, store, evaluate, deliver. Each can be replaced on its own. We swapped the log store during live operation without touching a single rule.
Collection uses a lean collector that accepts and normalises syslog, GELF and API sources. Evaluation then does not re-query the log store for every rule but works on a rolling time window, and that is the reason the interval stays stable at 30 seconds no matter how much is arriving.
Every monitor is its own small service with exactly one job, one owner and one alert text. Not a monolith with sixty switches. A monitor that reports nonsense gets switched off without touching the other 59.
Delivery runs on two tracks: anything that requires action goes out immediately as push and email to the owner, everything else is collected into a digest twice a day. That separation is not a convenience. It is the actual countermeasure against alert fatigue.
Day-to-day operation
The first monitor watches the pipeline itself. If ingestion stalls, events are not lost loudly but quietly, and the picture then looks calm while it is in fact blind. A stalled ingestion journal is therefore an alert with a priority of its own.
Suppressions exist, but they are narrow and justified: sign-ins from our own network are scored differently from those outside it. A blanket night-time mute we rejected deliberately. Attacks do not observe office hours, and the hours when nobody is looking are exactly the interesting ones.
Every false positive is fixed at the source. Not by raising the threshold. Raising thresholds is the route by which a security system goes quiet without anyone noticing.
Outcome
Around seven million events per day now flow through the pipeline: read by machines and not by people. Seconds rather than chance separate an event from an alert.
Security incidents, failed backups or storage filling up are noticed before they become a problem, without additional staff and without licence costs for a cloud SIEM.
What we learned
A monitor for terminal server load showed plausible but incorrect absolute values for weeks. The cause was a mix-up in definition: the metric in use was a single process's share and not the load of the system, and in the raw data the two are named almost identically. The rule since: pin down what a number means first. Then display it.
A detector for stalled storage replication was blind to exactly the fault we had built it for. It checked a counter that keeps advancing even during the failure. That lesson now sits in the build instructions for every new monitor: before it goes live, the fault case must have been induced artificially once and the alert actually seen. A monitor that has never fired is unproven.
Both cases have the same shape. It was not the system that failed but our assumption about what was being measured. Which is why the first question about a new alert is not “is this bad?” but: what exactly does this number count, and what would actually happen if the fault occurred?
 1 of 8
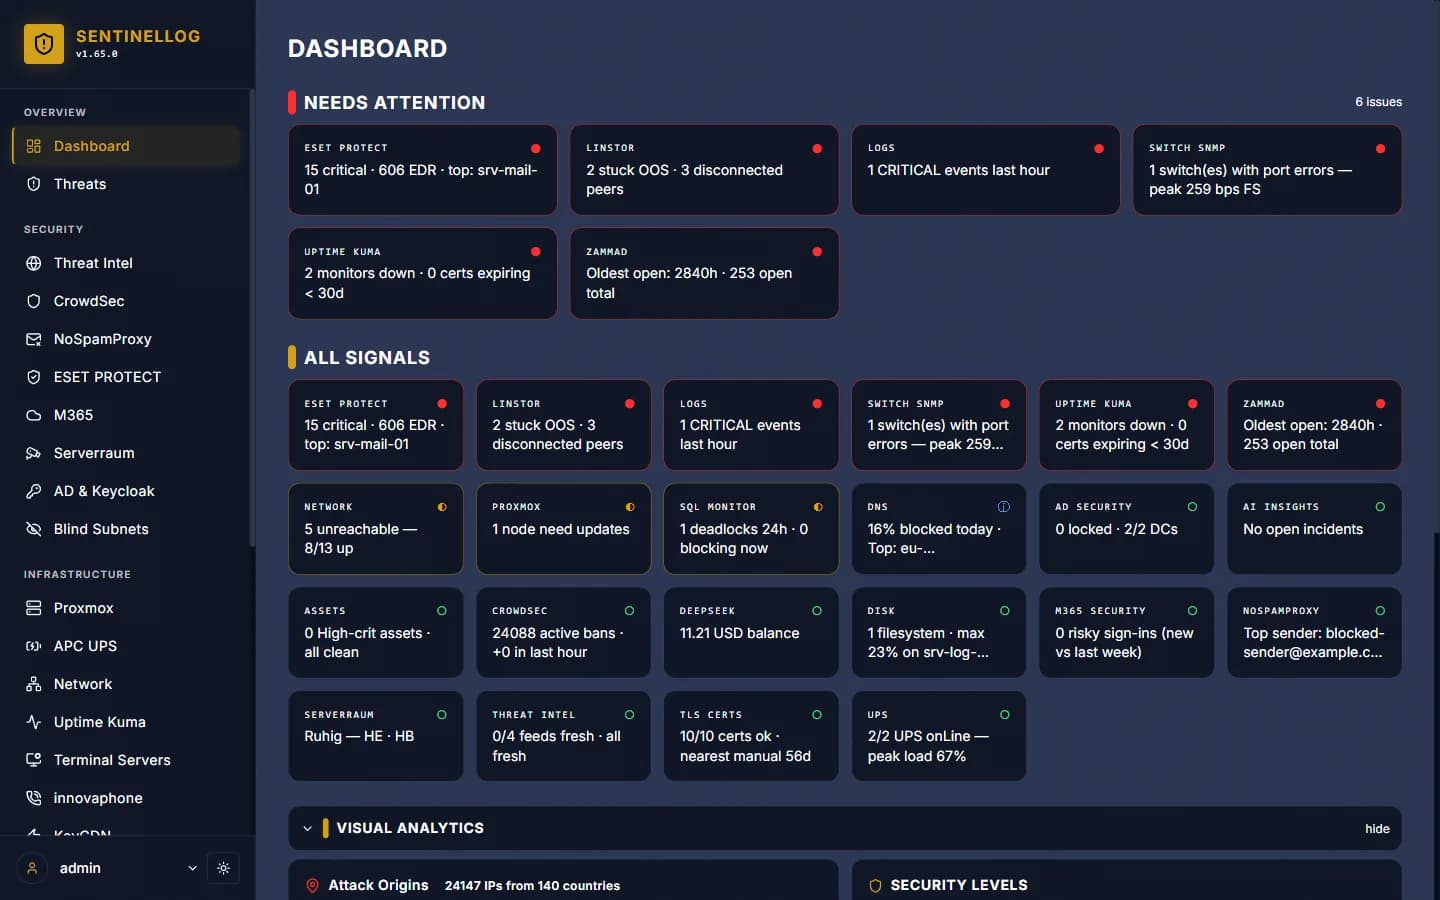
Dashboard: all signals and open findings at a glance.
Similar problem?
Tell us what you're planning, a short call clarifies whether it pays off.