 senn-tech
BI & controlling apps for management
Reference client: Logistics and trading group in Tyrol, Austria · ~100 employees · 4 sites
Customer data in copy and images has been neutralised.
Starting point
Anyone running a group of companies knows the ritual: the numbers arrive at month end — as a rigid report, or as a spreadsheet with five versions of the truth depending on who you ask. By the time everything was assembled, the month was old and the decision overdue.
This reference grew out of our own practice: built by someone who spent twenty years as managing director and owner — and wanted the figures not for IT, but for Monday morning.
What existed was the usual: an ERP with clean bookkeeping, an ageing report server with a handful of working reports, and spreadsheets that had grown over the years. None of it was wrong. It simply was not joined up, and nobody could say which figure was the current one.
The hard part
The difficulty was not the technology. It was what a number actually means. Four things had to be right before any chart was of use.
First: the fiscal year is not the calendar year. The ERP books calendar months, but reporting runs April to March — and the year key differs per company. An early version aggregated by calendar year and produced an operating result that was wrong on two counts at once.
Second: “result” is not a field, it is a definition. Coarse cost blocks sweep year-end entries and the financial result into the figure. Only a classification at account level, along the Austrian standard chart of accounts, separates operating result, financial result and tax cleanly.
Third, and this is the uncomfortable one: a complete fiscal year is not a closed one. Twelve months can be booked while depreciation, tax and provisions are still missing. The result then looks considerably better than it is. Leave that unmarked and you have built a cockpit that lies at exactly the wrong moment.
Fourth: intra-group revenue has to come out, or the group counts the same business twice. And whether a customer is intra-group is decided by their status today — not by their status when the invoice was written.
Solution
The result is a controlling cockpit with more than a dozen views: group consolidation across the companies, P&L, order intake, stock, open items, quarterly comparison, forecast, and a monthly market radar that summarises industry trends using a language model.
The data arrives on its own: a daily ETL before office hours from ERP and financial accounting, plus liquidity pulled directly from the bank six times a day. Alongside it, self-service BI with more than 20 dashboards and around 800 saved queries across 9 data sources — from the ERP to the ticket system.
A lean reporting layer replaces the old report-server output: six report types, produced on demand as HTML, PDF or Excel.
One component checks stock valuation statistically against each company's own twelve-month trend and flags outliers with a traffic light — with a jump straight to the individual article that caused it.
The forecast is deliberately conservative: booked year-to-date plus the remainder of the year taken from the prior year. No model, no smoothing — a figure whose derivation fits in one sentence.
How it is built
The cockpit only reads. It writes back to no source system, and that single design decision carries everything else: it makes operation low-risk, every mistake reversible, and the rollout something you can pull past a running ERP without anyone in accounting getting nervous.
A nightly ETL pulls the data from ERP and financial accounting into a dedicated PostgreSQL database, cleanly separated into raw data and derived views. All the domain logic sits in SQL views rather than application code: fiscal year, account classification, group consolidation, key figures. That has one unremarkable but decisive advantage. Anyone who doubts a number can trace it down to the individual booking without reading a line of program code.
The interface is kept thin. A Django application queries the views and draws them; every chart can be switched to the table behind it. Access runs through the group SSO, and group-level figures are restricted further to a named set of people.
The import window covers the last complete fiscal years plus the current one and rolls forward by itself. Nobody ever has to add a year.
Day-to-day operation
The ETL runs at night, the database is backed up daily. But a figure in the cockpit only becomes a statement once you know how old it is. That is why the data timestamp sits on every page.
A provisional fiscal year carries a warning that disappears by itself once the annual accounts are booked. It is detected by a single property: in a closed year all P&L accounts sum to zero, and as long as that sum does not come out, the figure stays provisional, however complete and audit-ready it may look at first glance.
Correctness is not asserted here. A verification suite recomputes every key figure against the report-server output that has been in use for years, and if even one of them deviates, the build is not shipped at all.
Outcome
The monthly view takes minutes instead of days — and there is exactly one data state, not five spreadsheet versions.
Consolidated group figures, same-day liquidity and an automatically generated market trend report: leadership working with today's numbers instead of the week before last.
The consolidation matches the existing official report to the cent — verified across six fiscal years. That was the precondition for the cockpit being taken seriously at all: a new figure that differs from the old one does not get believed, it gets ignored.
What we learned
The stock check laid a booking at our feet that nobody had seen for years: an opening entry worth a double-digit million sum, with zero quantity, re-booked every 1 April, with no offsetting entry. It had inflated that company's stock value roughly 180-fold. The error was not in the reporting. It was in the source system. That is exactly what a plausibility check is for: not to produce pretty traffic lights, but to find out that a number should never have been trusted.
The forecast once got the direction wrong, not the magnitude. We had counted the current, partially booked month as a full one, two days of bookings therefore passed for four weeks, and an eight percent increase turned on paper into a decline. It was not us who noticed. It was somebody who held the number up against their own instinct. Since then the calculation ends at the last completed month.
Both mistakes have the same thing in common. No code review would have caught them; what caught them was recomputing against an independent source people already trusted. For numbers somebody bases a decision on, that is not optional.
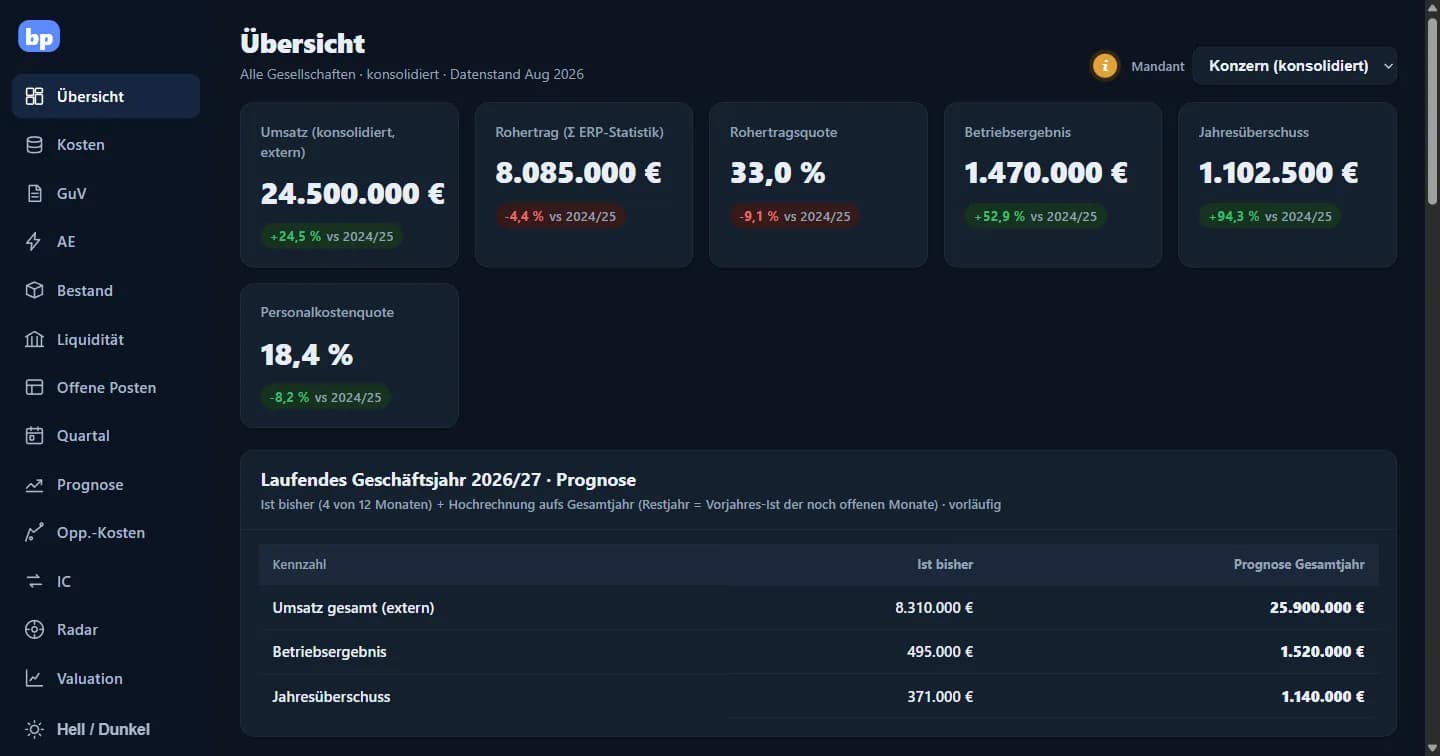
The overview: revenue, gross profit, operating result and the full-year projection, every figure set against the prior year. All values shown are sample data.
Similar problem?
Tell us what you're planning — a short call clarifies whether it pays off.